Providers of laser
components and laser
related accessories
Thermal Image Plate & Thermal Imaging for Co2 Lasers
; return false;" class="fancybox)
Thermal Image Plates
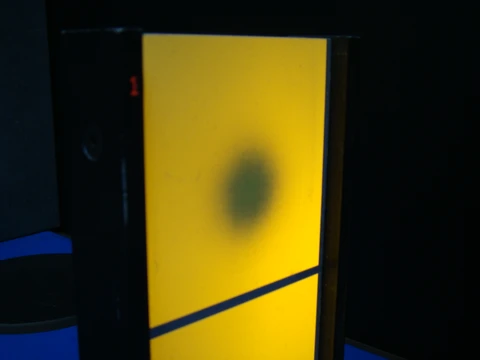
No longer are the firebricks and smoldering paper "tools of the trade" for researchers working with CO2 lasers. Now it's possible to see IR laser beams in real time and with high resolution using a Thermal Image Plate. The characteristics of this instrument enables it to solve a wide range of problems.
For example: The fast response time permits it to be used for viewing rapidly changing laser mode patterns when adjusting resonator mirrors. The convenient shape permits it to be placed next to optical elements to locate and center laser beams. The high resolution permits it to be used as a diagnostic tool to examine imerfections in IR optical elements or as an aide in optical alignment.
Even the critical adjustment of a laser interferometer is greatly simplified when the interference fringes of two misaligned beams become clearly visible.
Theory of Operation
The Thermal Image Plate displays the IR laser beam through the use of thermal-sensitive phosphors. When illuminated these phosphors fluoresce by a long wavelength ultraviolet light (3600A). The intensity of the fluorescence decreases with increasing temperature. When an IR laser beam strikes the thermal-sensitive surface, the absorbed energy raises the surface temperature and produces a corresponding thermal image. The produced pattern appears as a dark image on a bright fluorescent background when the surface is illuminated by an ultraviolet light. Different sensitivity ranges are obtained by using different phosphors and by varying the amount of thermal insulation between the phosphors and the anodized aluminum heat sink.
Any long-wavelength ultraviolet light can be used to illuminate the surface, but our lamp model MAC22UV is the most satisfactory. Its small size and high-illumination level permit it to be conveniently positioned out of the working area.
Description
The power density of CO2 laser beams ranges from those which can rapidly burn holes in firebrick to those that can't be felt on the back of the hand. Eight different surfaces with overlapping sensitivies are used to smoothly span the power density range from 200 watts/cm2 to 0.01 watts/cm2. (The minimum detectable power for a focused beam is less than 0.001 watts.) Thermal Image Plate MAC22-A contains four surfaces which cover the power densities commonly obtained from CO2 laser beams as they emerge from the laser. The lower power densities usually found in optical systems and divergent beams are covered by Thermal Plate MAC22-B.
The physical dimensions of each Thermal Plate (MAC22-A and MAC22-B) are 6" x 3 1/2" x 1". Each side of these plates contains two sensitive surfaces which are 3" x 3". The ultraviolet lamp (MAC22UV) measures 6" x 2" x 2".
Power Dissipation
A Thermal Image Plate is capable of displaying beams up to 200 watts. However, it must be removed from the beam and allowed to cool when there is a marked decrease in overall fluorescence. This occurs when the plate has absorbed 15,000 watt seconds of power. Powers less than 30 watts can be dissipated indefinitely.
Safety
Precautions have been taken to eliminate specular reflections from the Thermal Image Plate. Both the thermal-sensitive surfaces and the anodized aluminum hav matte finishes and show little surface reflection at 10.6 microns. However, standard safety precautions such as wearing protective glasses should always be observed when working with IR lasers.
The following table gives the specfications of the eight surfaces measured at 8 to 12 microns. For use at 4 to 8 microns, multiply columns a, b and c by 2. For use at 2 to 4 microns, multiply columns a, b and c by 2.5
| Model Number | Surface Number | Normal Sensitivity Range (a) w/cm2 | Minimum Power Density (b) w/cm2 | Damage Threshold (c) w/cm2 | Response Time(d)sec. | Resolution (a) lines/in. | Fluorescent Color |
|---|---|---|---|---|---|---|---|
MAC22A |
1 |
60-200 |
16 |
800 |
0.03 |
300 |
yellow |
MAC22B |
5 |
3.3-11 |
0.9 |
100 |
0.06 |
100 |
yellow |
a. The normal sensitivity range is the spread of power densities which can be easily viewed with no reduction in background illumination. The upper power density occurs when the surface becomes saturated, turning the area completely black and making it incapable of displaying any further detail within the beam.
b. The minimum-detectable power densities are the lowest power densities observable under the most favorable illumination levels. For this sensitivity the room lights must be dimmed and the level of ultraviolet illumination decreated to produce a dim fluorescense.
c. Damage threshold is the power density which produces a permanent change in the thermal- sensitive surface. This occurs at power factors at least four times greater than saturation. Therefore, when saturation occurs, a lower sensitivity surface should be used to display the beam.
d. The response time is the length of time it takes a change in the beam to be displayed as a change in the thermal image.
e. The resolution of a surface is the maximum number of dark and light line pairs which can be displayed with good contrast. For comparison, the resolution of a newspaper photograph is approximately 70 lines/inch. Two Co2 laser beams intersecting at an angle of two degrees produce an 80 line/inch interference pattern.

Thermal Image Kit (Two image plates and 120V lamp in Case)
Regular price: $578.00
Thermal Image Kit (Two image plates and 220V lamp in Case)
Regular price: $582.00
Water-Cooled Thermal Image Plate (Surfaces 1 & 2)
Regular price: $314.00
Water Cooled Thermal Image Plate (Surfaces 3 & 4)
Regular price: $314.00
MAC22B Thermal Image Plate (Surfaces 5, 6, 7, 8)
Regular price: $281.00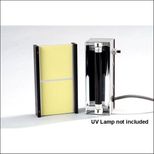
MAC22A Thermal Image Plate (Surfaces 1, 2, 3, 4)
Regular price: $281.00
Hard Plastic Case for Thermal Image Plates
Regular price: $37.00
Ultraviolet Lamp, 110 volt
Regular price: $170.00
UV Replacement Bulb for UV Lamps
Regular price: $43.00